Solar Energy UK Statistics: Facts and Figures for 2026

- The UK generated 14.43 billion kWh of solar electricity in 2025, enough to power over 5 million homes.
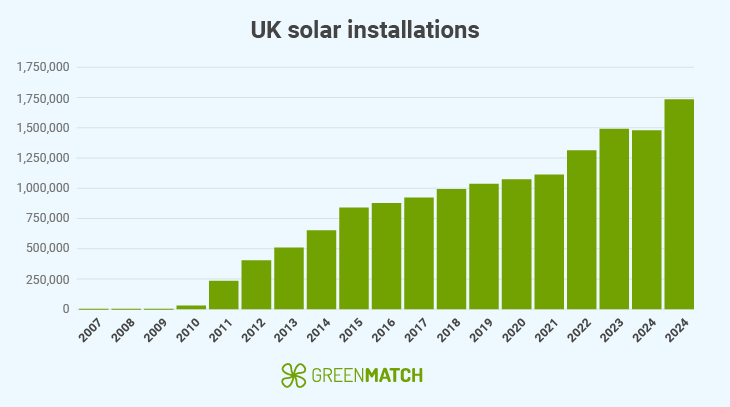
- Solar panel installations in the UK hit 1.73 million in 2025, a 6.8% rise from the previous year.
- Renewables now provide 37% of the UK’s electricity, surpassing fossil fuels for the first time.
- Solar panel costs have dropped by 90% globally, making solar more affordable than ever.
- Major challenges like grid limitations, policy changes, and labour shortages could slow future growth.
The solar energy market is seeing unprecedented growth in the last several years, both here in the UK and globally. By looking at the latest market trends and statistics, we can see just how popular solar energy really is and how quickly it is evolving.
As of 2025, the expected solar energy output here in the UK is expected to reach 14.43bn kWh. To put that into perspective, the average home in the UK uses around 2,700 kWh per year, meaning this output could potentially power around 4.8 to 5.3 million homes for an entire year. Showing that solar energy has the potential to replace fossil fuels as the UK's primary energy source.
In fact, according to an Ember report, 2024 marked a historical moment for solar energy here in the UK. Renewables accounted for 37% of the UK’s energy compared to fossil fuels at 35%. This adoption and growing interest are driven by the UK’s push to reach net zero emissions by 2050, government grant schemes, advancements in solar technology as well as the declining cost of solar panels.
In this article, we'll break down the most up-to-date solar energy statistics, highlighting emerging trends, exploring the potential economic impact and looking ahead to the future of solar energy in the UK and beyond. Understanding these statistics helps us anticipate where the solar industry is headed and how it could shape our energy future.
- Solar photovoltaic statistics and facts
- UK regions and solar installations
- Solar energy growth and capacity
- Solar power production by country
- Solar energy jobs and economic impact
- Solar market insight report
- Market outlook as of 2025
- How much do solar panels set you back in 2025?
- Solar panel efficiency and sustainability
- Future trends in solar PV
- FAQ
Solar photovoltaic statistics and facts
- The first solar panel was created in 1883 and could only convert 1-2% of solar energy into electricity.
- Today’s modern solar panels can convert up to 22% of sunlight into usable energy.
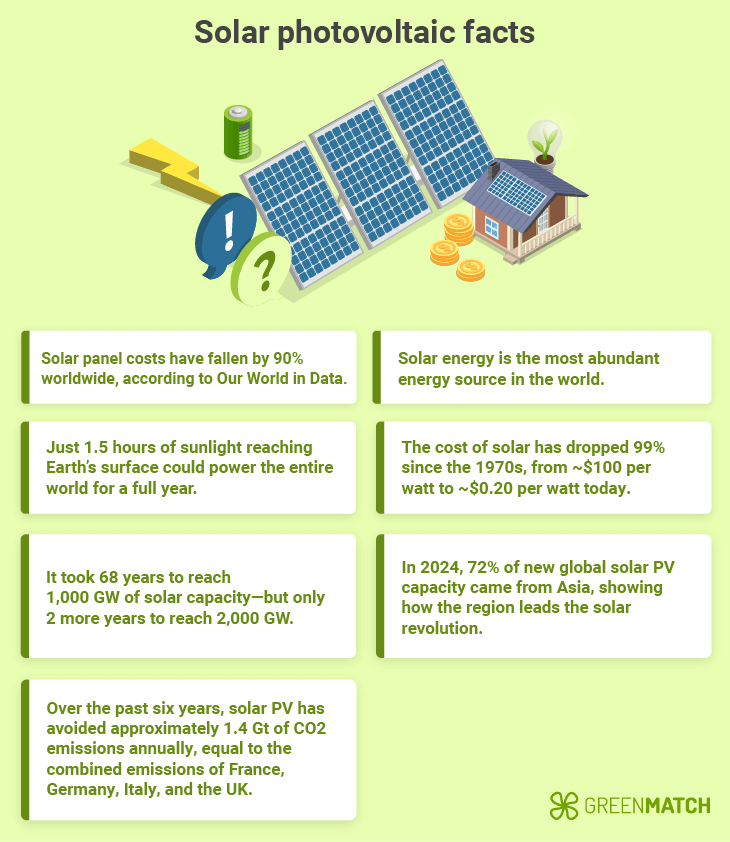
- Solar energy is the most abundant energy source in the world.
- According to the US Department of Energy, just 1.5 hours of sunlight reaching the Earth’s surface could power the entire world’s energy needs for a full year.
- Research into perovskites solar energy could see the efficiency increase by 33.9% in the future.
- 40% of the world’s electricity is now generated without burning fossil fuels.
- Solar panel costs have fallen by 90% worldwide, according to Our World Data.
- Since the 1970s, the cost of solar has dropped 99%, from around $100 per watt (£77.09) to just under $0.20 per watt (£0.15) today.
- The increase in government incentives and policies has accounted for about 60% of the overall cost decline in solar panels, according to MIT.
- The global solar photovoltaic capacity is expected to increase by 698 GW in 2025 compared to the 2024 figure of 599 GW.
- In 2025, the solar photovoltaic capacity has reached 2,000 GW.
- It took 68 years to reach 1,000 GW between 1954 and 2022, but only two years to reach an additional 1,000 GW.
- The solar PV market is expected to grow at a 7.84% compound annual growth rate (CAGR) globally from 2025 to 2033.
- Global solar PV investments in capacity additions increased by about 30% in 2023 and surpassed USD 480 billion.
- In 2024, 72% of all new solar photovoltaic (PV) capacity installed globally came from Asian countries.
- As of February 2025, 18.0 GW of solar energy is used in the UK.
- In 2025, the UK saw 1,735,000 solar panel installations (most of which were domestic) which was a 6.8% increase from the previous year.
- Renewable energy now accounts for 37% of UK electricity generation, compared to 35% from fossil fuels.
- The Smart Export Guarantee (SEG) has increased solar energy in the UK by allowing solar panel owners to sell off their excess energy back to the grid, encouraging further adoption, which contributes to the decline in costs.
- An all-day occupied household in the UK can save up to £690 annually by using solar energy.
- In the UK, the solar energy market is expected to grow by 1.97% CAGR between 2025 to 2029.
- China has invested up to $50 billion in solar PV since 2011, according to the IEA.
- China dominates solar PV manufacturing, responsible for more than three-quarters of global capacity.
- The Asia-Pacific region as a whole (including China) makes up over 90% of global production.
- Over the past six years, solar PV deployment has avoided approximately 1.4 gigatonnes (Gt) of CO2 emissions annually, which is equivalent to the combined annual emissions of France, Germany, Italy, and the United Kingdom.
UK regions and solar installations
As of 2025, the UK saw a 6.8% increase in solar panel installation from the previous year. Confirmed by GOV.UK, as of December of 2024, a total of 1478,099 solar energy installations occurred over the span of the entire year. Below is a breakdown per region based on the latest reports from GOV.UK:
| Solar installations UK (Latest report- December 2024) | |||
|---|---|---|---|
| UK region | Number of solar installations | Constituency with most Installations | Constituency with least installations |
| North East | 66,024 | Houghton and Sunderland South (4,730) | Gateshead Central and Whickham (945) |
| North West | 135,180 | Westmorland and Lonsdale (4,262) | Liverpool Wavertree (920) |
| Yorkshire & Humber | 120,987 | Thirsk and Malton (4,596 installations) | Sheffield Central (686) |
| East Midlands | 133,115 | Boston and Skegness (5,086) | Leicester South (1,602) |
| West Midlands | 112,506 | North Herefordshire (4.713) | Smethwick (791) |
| East | 177,446 | Peterborough (7,194) | Watford (985) |
| London | 56,229 | Hornchurch and Upminster (1,621) | Kensington and Bayswater (288) |
| South East | 215,982 | East Hampshire (4,153) | Portsmouth South (771 installations) |
| South West | 202,859 | North Cornwall (6,358) | Bournemouth East (1.501) |
| Wales | 99,431 | Caerfyrddin (5,362) | Cardiff North (1.482) |
| Scotland | 125,741 | Stirling and Strathallan (5.542) | Edinburgh North and Leith (412) |
| Northern Ireland | 28,870 | South Down (2,338) | Belfast South and Mid Down (676) |
| Unaccounted | 3.729 | N/A | N/A |
Solar energy growth and capacity
According to the IRENA, renewables account for 90% of global power expansion, with solar energy expected to increase by 698 GW in 2025. In the UK, the solar energy capacity has risen from 95 megawatts in 2010 to 18 GW; that’s an astonishing 18,847% increase.
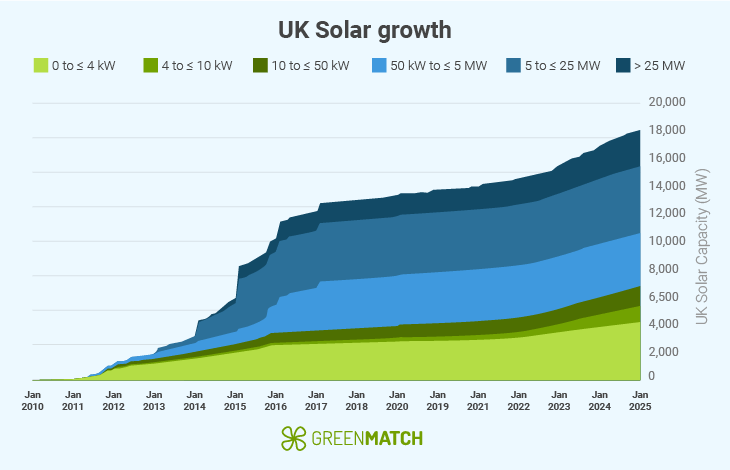
In February 2025, the UK saw 1,735,000 solar panel installations. A decade ago, in 2015, there were just 839,879 solar energy installations, according to Statistica.
Although the adoption of solar energy has grown over the past decade, there are notable trends to be aware of that have impacted solar energy growth and capacity in the UK. These include:
- 2010-2015: The UK government implemented the Feed-in-Tarriff (FiT), which gave users of renewable energy 21p per kilowatt used. As a result, there was an 18,414.5% increase in solar energy adoption from 2009 to 2015.
- 2016-2019: The government reduced the FiT rates from 21p to 16p per kilowatt, according to the Guardian. As a result of these cuts, the pace of growth for solar energy began to slow down.
- 2020: The UK introduced the Smart Export Guarantee (SEG); however, a mixture of low rates compared to the FiT scheme, as well as the pandemic lockdown restrictions, supply chain interruptions, and workforce limitations, led to installation delays and a temporary dip in activity across the construction and energy sectors.
- 2023- 2024: The introduction of “Part L” in building regulations mandated better energy performance for new builds. This lead developers to add solar panels to meet energy requirements. By the end of 2024, 42% of new builds in England were equipped with solar panels, up from 13% from the previous year, according to The Times.
On top of policy changes, the adoption of solar energy in the UK has increased because of the declining prices of solar panels. According to OurWorldData, solar panel prices have decreased by 90% globally. This is thanks to technological advances, efficiency in production and market competition. As of today, solar energy costs just under $0.20 per watt (£0.15), compared to prices of $100 per watt (£77.09) in 1970.
Solar power production by country
| Solar power by country | ||
|---|---|---|
| Ranking | Country | Solar power produced (MW) |
| 1 | China | 609,921 |
| 2 | United States | 139,205 |
| 3 | Japan | 89,077 |
| 4 | Germany | 81,739 |
| 5 | India | 73,109 |
| 6 | Brazil | 37,449 |
| 7 | Australia | 32,612 |
| 8 | Spain | 31,016 |
| 9 | Italy | 29,795 |
| 10 | Netherlands | 23,904 |
| 11 | South Korea | 23,493 |
| 12 | France | 20,551 |
| 13 | Vietnam | 17,077 |
| 14 | United Kingdom | 15,919 |
Note: These figures come from recent surveys of 2023 completed by the World Population Review.
Solar energy jobs and economic impact
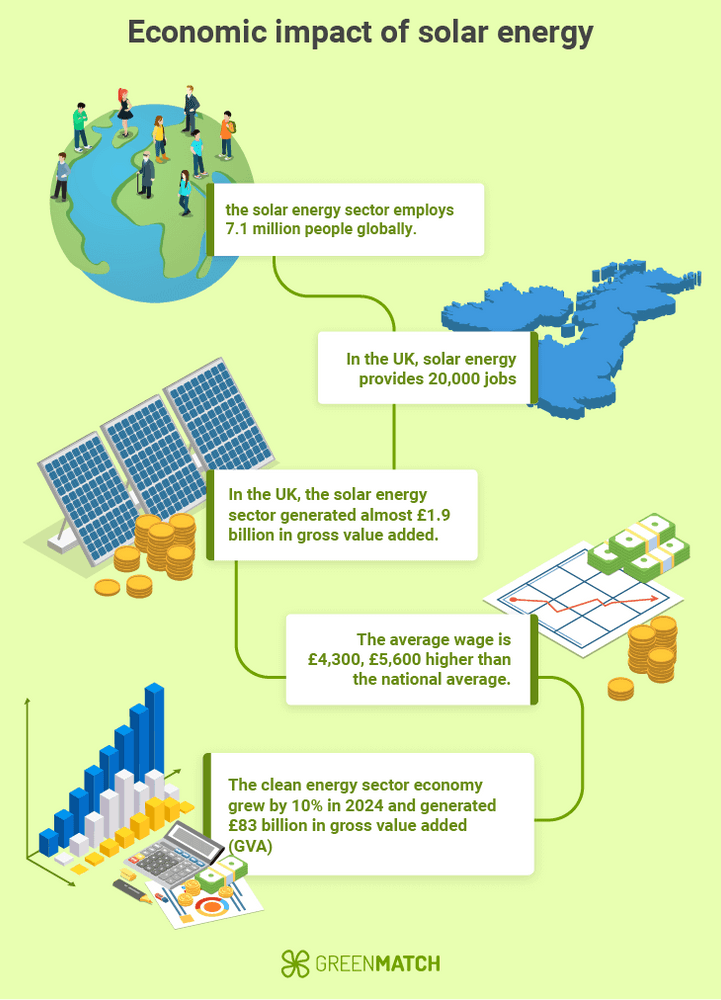
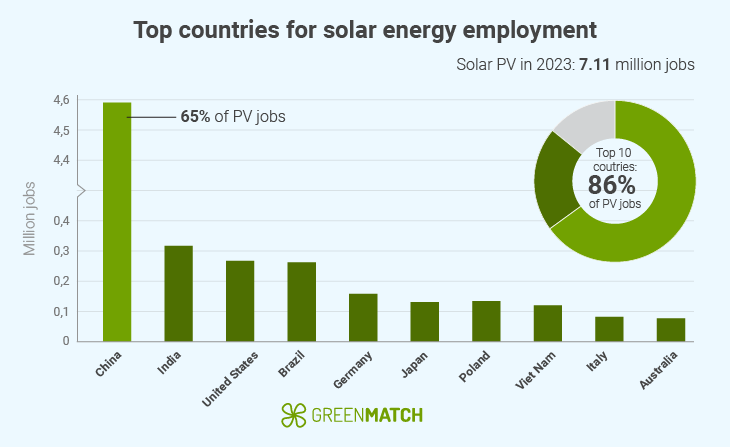
As of 2023, the IEA states that the energy sector employs over 67 million people globally, which increased by 3.8% from the previous year. The largest of this increase came from the clean energy sector. According to IRENA, the solar energy industry alone accounts for an estimated 7.1 million jobs worldwide.
Here in the UK, the solar energy sector generated almost £1.9 billion in gross value added (GVA), a measure of how much value companies add through the goods and services they produce, and has supported nearly 20,000 jobs. According to Solar Energy UK, the GVA of the solar energy industry is expected to increase to £5 billion by 2035, with almost 43,000 jobs.
The target for net zero emissions in the UK has created a booming economy. According to the Guardian, this economy grew by 10% in 2024 and generated £83 billion in gross value added (GVA). Research by the Confederation of British Industry (CBI) found that the green sector, including solar energy, employs almost a million people with full time jobs, with an average wage of £4,300, £5,600 higher than the national average.
One challenge that faces the solar energy industry is the demand for highly skilled labour. According to the IEA, around 45% of jobs in the solar and clean energy industry require highly skilled workers, which could limit scalability. To address this concern, many are looking at the transition of workers from the fossil fuel sector into clean energy roles.
While the solar energy industry is rapidly growing and employing millions of people, the fossil fuel sector still supports 32 million jobs. As the dependency on fossil fuels declines, many workers risk facing redundancy. However, this presents an opportunity. Fossil fuel workers often possess the necessary skills that align with solar energy roles. If this works out, this transition could fill gaps in the sector and also support a just and inclusive energy transition.
Another huge potential in the solar energy sector is helping communities that are currently without electricity. According to the World Health Organisation, 685 million people worldwide are without electricity. This provides a gap for the solar energy sector to not only provide energy to communities but could potentially provide jobs to those within the communities. However, it is important to note that this could take serious investment. If this were to occur, it could provide millions of jobs to disenfranchised communities, helping to reduce global poverty, improve access to education, and improve healthcare.
Global solar energy-related jobs by top country
Solar market insight report
In 2025, it is estimated that solar panels around the world are expected to generate 1.39 trillion units of electricity, with the UK contributing to 14.43bn, as reported by Statistica. Here is the breakdown of the top countries:
| Solar energy market projections 2025 | |
|---|---|
| Country | Energy market (kWh) |
| China | 397.43bn |
| United States | 181.55bn |
| Japan | 113.53bn |
| Germany | 71.85bn |
| India | 104.59bn |
| Brazil | 46.75bn |
| Australia | 35.49bn |
| Spain | 63.52bn |
| Italy | 36.47bn |
| Netherlands | 29.82bn |
| South Korea | 23.47bn |
| France | 29.98bn |
| Vietnam | 29.43bn |
| United Kingdom | 14.43bn |
***FACT BOX***
- China and the U.S. are by far the largest solar electricity producers, with China alone generating more than the next three countries combined. This reflects their aggressive policy support and large-scale solar investments.
- Southern European countries (Spain, Italy) benefit from more consistent sunshine, giving them a solar edge over northern nations like the UK or Netherlands.
- Asia-Pacific is a growth powerhouse in solar. Even smaller nations are expanding rapidly due to energy security goals and high solar potential.
Rapid changes in technology, government policies, and global events make it difficult to confirm the exact value of the solar market, but estimates have been made.
Reports by the Business Research Company claim that the value of the solar energy industry was at around $277.93 billion in 2024 and is expected to increase to $282.25 billion in 2025 at a compound annual growth rate (CAGR) of 1.6%. This could potentially grow to $334.01 billion in 2029 at a compound annual growth rate (CAGR) of 4.3%.
Market outlook as of 2025
As of 2025, the solar market in the UK reached 18 GW, which is a 1.1 GW increase from February 2024, according to PV Magazine. With a significant shift to solar energy, the UK is noticing a push for solar adoption.
According to Statistica, the solar market here in the UK is to grow by 1.97%, reflecting the Compound Annual Growth Rate (CAGR) from 2025 to 2029, reflecting a modest but steady expansion in the market.
Throughout Europe, solar energy is noticing rapid growth in the solar energy market. Between January 2025 and March 2025, countries such as Germany, France, the UK and Poland saw a 25% increase in solar output compared to the same quarter in 2024, according to Reuters.
A significant share of this growth is driven by residential installations, which here in the UK accounted for 73% of the solar industry’s expansion (PV magazine). However, government incentives and clean-energy targets are also key players in solar energy adoption.
In December 2024, the UK government announced the “Clean Power 2030 Action Plan”, with an ambitious plan to make Britain a powerhouse in clean energy. This plan has set a target of 45-47 gigawatts (GW) of solar capacity by 2030, more than double the current levels. As part of this strategy, the government has increased its annual budget for renewable energy to £1.5 billion, according to the Financial Times.
The impact of this new policy is already visible. As of 2025, the UK has 357 solar energy projects in development, which could account for up to 30 GW. If completed, these projects would mark a major leap in the UK market.
Public-sector investments will also contribute to the expansion of the solar energy market in 2025. The state-backed Great British Energy initiative has committed up to £180 million to installing solar panels in schools and hospitals, according to BBC News, a move that reinforces solar’s role in reducing public energy costs and emissions.
With strong government support, rising adoption rates, and ambitious projects and targets, the solar market in the UK is set to steadily increase over the next several years.
How much do solar panels set you back in 2025?

The cost of solar panels in 2025 can range between £6,600 - £8,100 for a typical 2 to 3-bedroom home. However, there are several factors that can influence the cost, including:
- System size: Larger systems cost more overall but may have a lower cost per watt.
- Panel efficiency: High-efficiency or premium panels (e.g. monocrystalline, bifacial) cost more than basic polycrystalline options.
- Roof type and complexity: Installations on flat, slate, or complex roofs may increase labour and mounting costs.
- Battery storage: Adding a battery (e.g. for off-grid or backup power) significantly increases upfront costs.
- Location: Labour and installer prices vary by region; solar irradiance can also impact system size needs.
- Installer rates: More experienced or certified installers may charge more but offer better service and longer warranties.
- Government incentives: Solar panel grants can help offset the costs. However, you will need to meet certain criteria in order to obtain these grant schemes.
While solar panels prices in the UK can be costly, they can benefit homeowners majorly by helping reduce energy costs. Below is a table of solar panel costs per household size and the potential savings on energy bills:
| Solar panel cost | ||
|---|---|---|
| Household and system size | Average cost | Estimated savings |
| 1-2 bedroom (2kWh) | £3,800 - £4,600 | £783 |
| 1-2 bedroom (3kWh) | £5,700 - £7,000 | £783 |
| 2-3 bedrooms (4kWh) | £6,600 - £8,100 | £1,304 |
| 2-3 bedrooms (5kWh) | £8,300 - £10,200 | £1,304 |
| 4-5 bedrooms (6kWh) | £10,000 - £12,200 | £1,567 |
While solar panel costs are still expensive, there is a decline in solar panel prices. Over the last decade, solar panels have decreased in cost by 90%, which is thanks to the development of technology, an increase in market competition, and a better production process. According to Reuters, clean energy prices (including solar energy) are expected to fall by 22-49% by 2035.
This means that in the near future, solar panels will become even more accessible, helping to increase adoption rates, not only benefiting the market but also improving savings for homeowners.
Solar panel efficiency and sustainability
Solar panel efficiency is currently at 25%, a huge improvement from the first solar panel developed with an efficiency rate of only 1 to 2%. This means that 22% of the sunlight absorbed by modern solar panels is converted into usable electricity.
While solar energy is widely considered sustainable, especially compared to fossil fuels, it is not without its environmental concerns. These concerns are particularly focused on land use and solar panel waste.
Land use is a growing concern. As solar energy becomes more popular, there will be a huge increase in large-scale solar farms to keep up with demands. These farms, however, can contribute to land degradation and habitat loss. To reduce the risk of these issues, agencies are developing projects on brownfield sites and abandoned industrial or mining lands. For example, in the US, the EPA has set up “Renewable Energy Projects at Mine Sites” to reduce land waste and reuse abandoned sites.
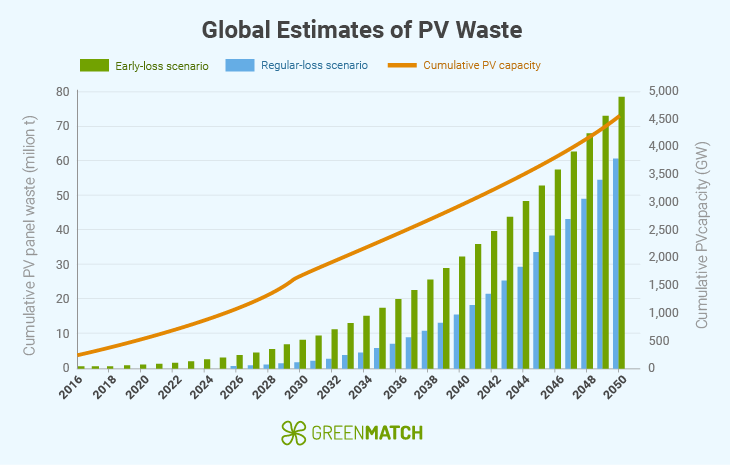
Solar panel waste is also a major concern, although it is rarely discussed in the solar energy conversation. According to IRENA, solar panel waste could reach up to 78 million tonnes by 2050. Despite its clean image, solar energy recycling is limited. The Harvard Business Review notes that it costs around $20–$30 to recycle one panel while sending it to a landfill would cost a mere $1–$2. This economic disincentive will only contribute to the waste.
Solar panels are currently made from silicon, although a durable material its production is energy intensive. As a result, among other sustainability concerns, researchers are looking at new ways to improve efficiency and sustainability within the solar energy industry.
In 2024, researchers in Oxford University's Physics Department developed a thin, flexible perovskite-based material. This material can be applied to different buildings, vehicles and other objects to generate energy. This not only helps reduce waste and land usage, but the department confirmed that the efficiency of this material increased to 27%.
Future trends in solar PV
The future of solar energy is expected to grow exponentially in the coming years, driven by energy demands, improved technology, and the global push for decarbonisation. From 2025, a number of key trends are set to shape the future of solar PV.
One of the clearest signs of change in the solar PV sector is growth. It took nearly 70 years to install the first 1,000 GW of global solar capacity, but only two years to add the next 1,000 GW, hitting a total of 2,000 GW by 2025. In the UK, adoption is rising steadily, with over 1.73 million solar installations recorded by early 2025, most of which were domestic installations.
There are still trends that are expected to influence solar PV, including:
- Solar technology: Advances in materials like perovskite solar cells are boosting efficiency and enabling new uses, including building-integrated photovoltaics (BIPV) and solar coatings, where panels are built into roofs, façades, or windows rather than mounted on top.
- Solar economics: The cost of solar panels continues to fall, making solar energy more accessible. As the solar energy industry continues to grow, the job market increases.
- Scaling and integration: Wider adoption of solar is driving demand for smart grid solutions, as outlined in the UK government's "Smart Grid Vision and Routemap", alongside the growth of community energy schemes and the integration of solar into urban infrastructure and new-build regulations.
- Public policy: Government support through schemes like the Clean Power 2030 Plan, net zero 2050, and updated building standards is accelerating solar adoption and guiding long-term investment in clean energy.
Despite the growth of solar energy, there are several challenges that could slow down its expansion if they are not addressed, such as:
- Skilled labour shortages: Solar energy requires around 45% of its workforce to be highly skilled. A shortage of skilled workers could limit the expansion of solar energy.
- Grid limitations: The existing grid infrastructure in many regions in the UK is not able to deal with solar energy demands. In the UK, some developers have faced curtailment limits of up to 90% in certain areas, according to Solar Energy UK. Serious investments need to be made in order to upgrade the grid.
- Policy uncertainty: Government policies can change over time. Changes to these policies can have an impact on the expansion of solar energy. For example, proposed changes to the UK's electricity market, like zonal pricing, could raise costs and delay clean energy investments, according to The Guardian.
While the solar PV market is on an upward trajectory, these concerns need to be addressed in order to ensure its steady growth into the future.
FAQ
We strive to connect our customers with the right product and supplier. Would you like to be part of GreenMatch?
