Electric Bikes: Stats, Trends & Facts

Electric bikes or e bikes have become popular as a green alternative to traditional transportation methods. They offer a blend of pedal power with an electric motor, providing a boost that can make cycling more accessible and appealing.
The allure of e bikes lies in their ability to attenuate the physical demands of cycling, making them a coveted choice for commuters, fitness enthusiasts, and those seeking a more approachable mobility medium. This has taken the UK streets by storm, with sales soaring 70% in 2023 compared to the previous year.
However, the environmental impact of e bikes is a nuanced topic that requires a closer look to understand their actual ecological footprint.
The manufacturing process of e bikes is similar to that of traditional bicycles, involving steps such as cutting metal into rods to prepare the frame, assembling various parts, and applying primer and paint. However, e bikes also include a battery, typically a lithium-ion battery, which requires additional resources and energy to produce.
Around 75% of these emissions are produced during the materials and manufacturing process, 15% during the actual use of the e-bike, and the remaining 10% during transport.
The European Cycling Federation estimates that manufacturing an e-bike has a carbon footprint of 134kg, while Trek suggests it's 165kg of CO2e.
Despite this, the carbon footprint of e-bike manufacturing is significantly less than that of producing a small hatchback car, which requires 5.5 tons of CO2e.
Types of Electric Bikes
This bike looks like a regular bicycle but includes a battery-powered motor to assist pedalling. However, there are different types of ebikes in the market today. Let's break it down by type.
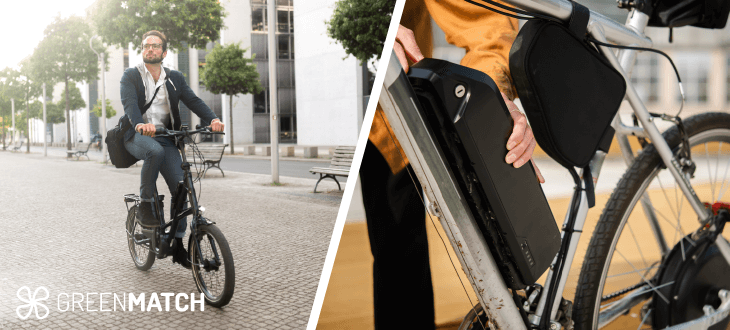
- City/Commuter E-Bikes: Designed for urban environments, city e-bikes prioritise comfort and practicality. City e-bikes suit commuters and errand runners looking to replace short car trips. Features often include fenders and racks for carrying items and easy mounting frames.
- Folding E-Bikes: Compact and portable, folding e-bikes solve storage issues for flat-dwellers or train commuters. While typically having smaller wheels, many folding e-bikes offer comfortable rides for shorter trips.
- Electric Mountain Bikes (eMTBs): For off-road enthusiasts, eMTBs provide extra power to tackle challenging terrain. eMTBs open trails to riders of varying fitness levels, allowing groups to enjoy adventures together. One of the key features is more powerful motors for steep climbs.
- Road E-Bikes: Sleek and speedy, road e-bikes cater to fitness-oriented cyclists. The characteristics of this e-bike include its lightweight frames and drop handlebars. Road e-bikes let riders extend their range or keep up with faster groups.
- Cargo E-Bikes: Built for hauling, cargo e-bikes offer a car alternative for families or businesses. Cargo e-bikes can easily transport children, groceries, or even business deliveries.
- Fat Tire Electric Bikes: Fat tyre electric bikes combine the benefits of fat bikes with electric assistance, creating a versatile and capable ride for various terrains. They are ideal for riders who want to explore off-road terrain, ride in snowy or sandy conditions, or enjoy a stable and comfortable ride on various surfaces.
How Much Power Does an Electric Bike Use?
E-bikes consume between 200 to 750 watts of power on average, providing a range of approximately 20 to 60 miles per charge depending on the terrain and riding conditions.
A 300wh battery with average usage will generally take you between 25km and 80km on a single charge. Based on average usage, a 400wh battery will generally last between 40km and 100km.
The average power consumption of an e-bike with a Bosch eBike system is about 11 Wh/mi. This value results from the R200 range test for pedelecs with a Bosch eBike system.
To estimate the power requirements for your electric bike, you can use the following formula: Power (watts) = voltage (volts) x current (amps). For instance, a typical electric bicycle setup has a 36V (volt) battery and a 15A (amp) controller. Wattage is just voltage multiplied by current, so 36 volts x 15 amps = 540 watts.
This energy consumption results in an average CO2 emissions value of 3.2-8 g/mile, depending on the electricity mix. A car emits about 240 g of CO2 per passenger mile, while public transportation emits between 80 and 176 g of CO2 per passenger mile.
Therefore, e bikes have significantly lower emissions than other transportation means.
Comparative Analysis with Other Transport Modes
When comparing e-bikes to cars and public transportation, e-bikes generally have a lower environmental impact. They emit fewer pollutants per kilometre travelled and require less energy to operate. Here's a comparative look at the emissions:
| Transport Mode | Average CO2 Emissions per Passenger-km |
| Car (Petrol) | 104g CO2e |
| Bus | 68g CO2e |
| Electric Bike | 22g CO2e |
The Environmental Footprint of E Bikes
E bikes are often lauded for their energy efficiency and low carbon emissions compared to cars and motorcycles. Operating requires less energy, and their impact can be minimal when charged using renewable energy sources. However, the production, usage, and disposal of e-bikes involve several environmental considerations.
This is seen in fat bikes as their larger tires and frames require more materials to produce, potentially increasing their manufacturing footprint compared to standard bikes. This is due to it oversized tires typically 3.8 inches or wider. The wide tires provide excellent traction and a smoother ride over rough surfaces.
Consequenctly, overall environmental impact of of all electric bikes depends on factors such as battery production and electricity sources.
Manufacturing and Materials Impact:
The production of e-bikes involves mining for metals like lithium, cobalt, and nickel for batteries, which has environmental consequences.
The production of e-bikes has a higher carbon footprint than conventional bicycles, with estimates suggesting that manufacturing an e-bike emits around 134kg CO2e, compared to 96kg CO2e for a regular bike. This includes the emissions from manufacturing spare parts over the bike's lifespan.
Battery Usage and Disposal
E-bike batteries have a limited lifespan. The disposal and recycling of these batteries pose environmental challenges due to the hazardous materials they contain.
Energy Source for Charging
The environmental friendliness of using an e-bike also depends on how the electricity is generated to charge the battery. The indirect emissions must be considered if the electricity comes from fossil fuels.
Solar-powered e-bike charging stations exemplify how eco-friendly e-bikes can be charged, utilising photovoltaic technology to convert solar energy into electrical energy.
Usage and Emissions
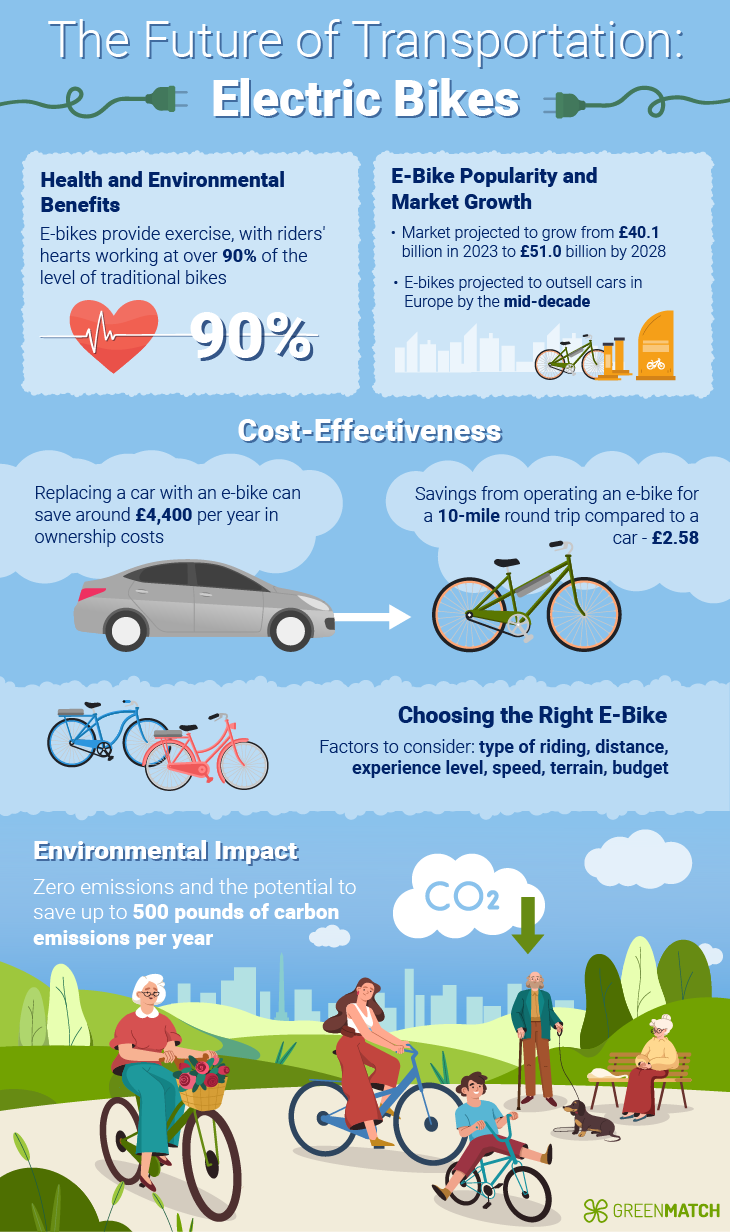
E-bikes are zero-emission vehicles at the point of use, meaning they do not emit tailpipe emissions like internal combustion engines. This can significantly reduce air pollution, especially in congested urban areas. UK law limits e-bike motors to 250 watts and speeds up to 15.5 mph. Beyond that, riders must rely solely on leg power - so e-bikes still provide exercise benefits.
When considering the emissions from the electricity used to charge e-bikes, they still have a lower environmental impact than conventional vehicles.
For instance, e-bikes emit approximately 14.8g CO2e per kilometre travelled, which is 30% lower than the emissions from cycling a conventional bike when accounting for the food-related emissions of the cyclist.
Comparative Environmental Benefit
E-bikes have a significantly lower environmental impact than cars and even electric cars. An e-bike can save up to 500 pounds of carbon emissions each year. For example, switching from a vehicle to an e-bike can save an average of 249g of CO2 for every kilometre travelled.
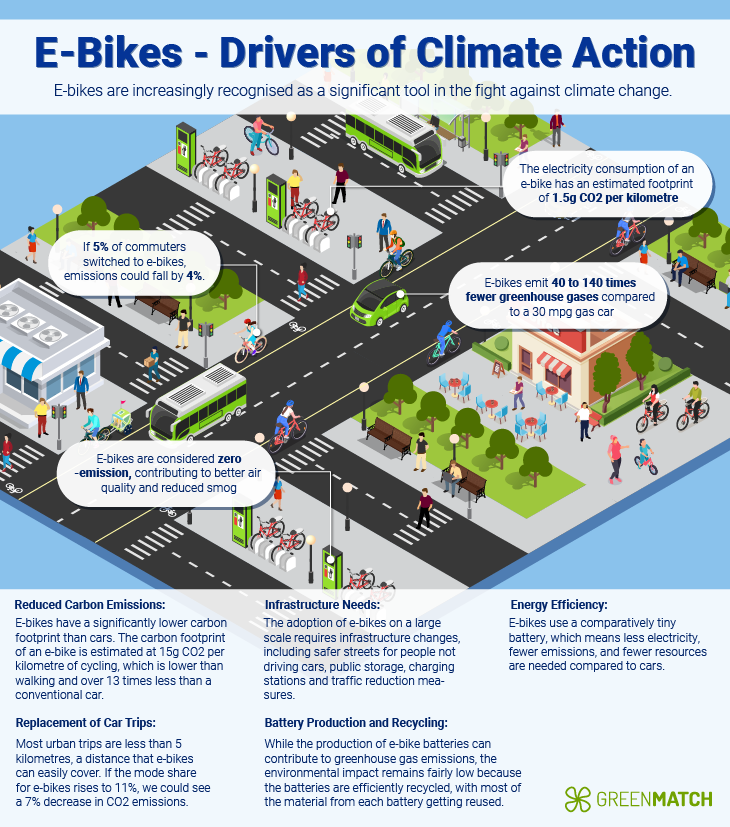
If e-bikes were used to replace car travel, they could cut CO2 emissions in England by up to 50%.
Moreover, e-bikes are 10 to 30 times more efficient than electric cars at fighting climate change and get 30 to 100 times more miles per pound of battery than an electric car. An e-bike emits 40 to 140 times fewer pounds of greenhouse gases than a 30 mpg gas car, assuming it is charged with California’s electric energy mix.
| Aspect | E-bike | Car | Electric Vehicle |
| Cost (Annual) | £200 - £10,000 | £2,730 | £720 |
| Speed (mph) | 15-20 | 60-155 | 60-155 |
| Range (miles) | 20-40 | 200-400 | 150-370 |
| CO2 Emissions during Production (kg) | 134-165 | 5,500 | 5,500-17,500 |
| CO2 Emissions per Mile (g/mi) | 3.2-8 | 240 | 0 (but CO2 emissions during charging) |
| Energy Consumption (Wh/mi) | 11 | 1,500-2,500 | 250-500 |
| Cost per Mile (£) | <0.01 | 0.23 | 0.06 |
Electric Bikes Key Market Players
The e-bike industry is a rapidly growing market with several key players contributing to its expansion, with the top five companies occupying 29.04% of the market.
Here are some of the most prominent companies in the industry:
- Accell Group NV: Based in the Netherlands, Accell Group is a significant player in the global e-bike market. The company's strategy to maintain its position includes solid mergers and acquisitions, partnerships, and technological advancement.
- Giant Manufacturing Co., Ltd.: This Taiwan-based company is one of the world's largest bike manufacturers. Giant is known for its reliable and value-oriented e-bikes.
- Yadea Group Holdings., Ltd.: Yadea, a Chinese company, is a crucial player in the e-bike market. It has a significant presence in the Asia Pacific region, which dominates the e-bikes market, with a share of 76.0% in 2022.
- Yamaha Motor Company: Based in Japan, Yamaha is a major player in the e-bike industry. The company is known for its technological advancements and high-quality products.
- Trek: Trek offers many e-bikes, including mountain, road, and city bikes, focusing on quality and innovative technology.
These companies continuously invest in research and development to bring innovations to the market. Technological advancements such as more powerful and efficient motors, IoT integration, and intelligent bikes are some of the trends in the e-bike industry.
The e-bike market is expected to grow from approximately 39.28 billion GBP in 2023 to about 49.84 billion GBP by 2028 at a compound annual growth rate (CAGR) of 4.9%.
Are E-bikes Sustainable?
E-bikes represent a significant step towards sustainable transportation. They offer a low-carbon, cost-effective, and health-promoting alternative to traditional vehicles. They offer a viable solution for reducing carbon emissions, traffic congestion, and dependence on fossil fuels.
For instance, an individual e-bike can reduce CO2 emissions by 225 kilograms yearly when replacing car trips. Moreover, e-bikes are up to six times more efficient than trains, making them a highly eco-friendly travel option.
E-bikes and Cost-Effectiveness
E-bikes are not only environmentally friendly but also cost-effective. The cost of charging an e-bike is minimal. For instance, it costs just over 6.5 cents to charge a decent-sized e-bike battery fully. Moreover, e-bikes are lighter than standard cars, meaning they take up less room on the road, reducing traffic jams and wear and tear on roadways.
E-bikes and Urban Mobility
E-bikes can significantly expand the possibilities for urban mobility without considerably changing the fundamental benefits of cycling. They allow riders to cover longer distances and overcome more significant differences in altitude, making them a practical alternative for commuting and urban travel.
Research has shown that e-bike users tend to ride for more extended periods and cover longer distances than conventional cyclists.
E-bikes and Infrastructure
While e-bikes offer significant potential for sustainable mobility, their widespread adoption faces challenges related to infrastructure. Advocacy for safer speeds, protected bike lanes, traffic reduction, and more inclusive road planning is crucial to making cities more e-bike-friendly.
As technology and recycling programs continue to improve, the sustainability of e-bikes is likely to increase.
| E-Bike Aspect | Sustainability Impact |
| Production | Contributes to CO2 emissions, but significantly less than traditional vehicles |
| Use | Zero-emission vehicles, reducing carbon emissions and air pollution |
| Battery Life | Batteries can potentially end up in landfills, but recycling initiatives exist. |
| Environmental Benefits | Reduces air pollution and carbon emissions, more efficient than other forms of transportation |
| Economic Benefits | Cost-effective, less than a penny per mile to charge |
Can E-Bikes be Recycled?
Yes, e-bikes can be recycled. The recycling process involves dismantling the e-bikes into their raw components, mainly removing lithium-ion batteries to mitigate potential hazards.
Recycling e-bikes, particularly their batteries, is critical to their sustainability profile. These batteries, particularly lithium-ion batteries, pose a potential fire risk when stored incorrectly and are susceptible to water damage. Recycling services, such as Velorim Recover, have emerged to dispose of end-of-life e-bike batteries safely.
| Component | Material | Biodegradability | Recyclability |
| Frame | Aluminum | No | Yes |
| Battery | Lithium-ion | No | Yes |
| Seats | Pineapple fibers | Yes | Yes |
| Side Panels | Flaxseed | Yes | Yes |
| Motor | Various metals, plastics | No | Partial |
Other organisations like the Bicycle Association (BA) are setting up UK-wide electric bike battery collection and recycling services to deal with the expected growth in e-bike sales and to provide a straightforward and convenient way for customers to return batteries.
E-bikes and their components, including batteries, can be recycled through specialised services and facilities that ensure these materials are safely and environmentally responsible for disposal.
Are Electric Bikes Biodegradable?
Electric bikes (e-bikes), as a whole, are not biodegradable. However, specific components of e-bikes can be made from biodegradable materials. The materials used in constructing e-bikes, such as metals, plastics, and electronic components, are generally not biodegradable. However, some companies are exploring using recyclable and biodegradable materials in their production.
For instance, the seats of their motorcycles are made from natural fibres derived from pineapples, mangos, or corn, and the side panels are made from flax seed rather than plastic. The pigments used for colouring the bodywork are derived from natural algae, and the aluminium frame is recyclable. The battery pack is designed to be swappable, which can extend the life of the electric bike and reduce waste.
What are the Alternatives to E-bikes?
Electric bikes have gained significant popularity recently due to their convenience, speed, and eco-friendliness. While e-bikes offer numerous benefits, several alternatives that cater to different needs and preferences are available.
However, there may be better fits for some.
| Alternative | Pros | Cons |
| Regular Bicycles | Eco-friendly, Exercise, Cost-effective | Slower, More effort required |
| E-bike Conversion Kits | Cost-effective, Utilizes existing bike | Requires installation, Not as efficient as dedicated e-bikes |
| Mopeds and Electric Scooters | Faster, Lighter, No license required | No pedals, Not as eco-friendly |
| Public Transportation | High capacity, Covers long distances | Fixed routes and schedules Can be crowded |
| E-bike Sharing Systems | Convenient, Affordable, Wide availability | Limited to certain areas, availability depends on demand |
Remember, the best alternative for you will depend on your specific needs, such as your commute distance, the terrain you'll be travelling on, your physical condition, and your budget.
Stats, Facts and Figures About E-Bikes
Let's look at the global statistics based on analysis from market trends and consumer perspectives.
- The global e-bike market was valued at approximately £14.3 billion in 2022 and is projected to grow at a compound annual growth rate (CAGR) of 14.5% from 2023 to 2030. The expected growth rate remains at 7.49% between 2020-2025.
- Asia Pacific, particularly China, dominates the e-bike market, accounting for 76.0% of the market share in 2022.
- China is the largest manufacturer and supplier of e-bikes, producing approximately 36 million units annually.
- Pedal-assisted electric bicycles are the most popular type of e-bike, accounting for 88.36% of the global market.
- In the United Kingdom, the e-bike market size was estimated at £361.5 million in 2023 and is expected to reach £632.85 million by 2029.
- E-bike sales in the UK have tripled in the past five years, from around 55,000 bikes sold in 2017 to 160,000 in 2021.
- E-bikes are zero-emission vehicles which do not contribute to air pollution or global warming.
- Using e-bikes can save up to 500 pounds of carbon emissions each year.
- An e-bike emits 40 to 140 times fewer pounds of greenhouse gases than a 30 mpg gas car.
- In the UK, 43% of adults expressed interest in test-riding an e-bike.
- In the UK, the e-bike market size was estimated at £451.51 million in 2023 and is expected to reach £832.85 million by 2029.
- E-bike sales in the UK have tripled in the past five years, from around 55,000 bikes sold in 2017 to 160,000 in 2021.
- The average cost of an e-bike has risen by over 25% since the start of the COVID-19 pandemic, which has been a significant barrier to e-bike sales.
- In the U.S., 59% of e-bike owners are male, while 41% are female.
- On average, e-bike rides replaced 1,778 motor vehicle miles (an average of 9.3 miles per trip) within the last three trips reported by respondents.
- More than half of all adult bikes sold in the Netherlands were electric.
E-Bike Adoption in Major Economies
E-Bikes in Asia
Asia is the largest e-bike market in terms of manufacturing and selling. In this region, China was the largest market for e-bikes in 2022, followed by Japan, India, South Korea, and Taiwan. China has up to 200 million e-bikes in use.
E-Bikes in Europe
Europe is a leading market for e-bikes, with countries like the Netherlands and Belgium experiencing significant e-bike adoption. Germany is Europe's largest electric bicycle market, with 2.2 million new e-bikes sold in 2022. The Netherlands has hit a milestone where over 50% of the country's total bike retail value is from e-bikes.
The Confederation of the European Bicycle Industry (CONEBI) expects the size of the European e-bike market to grow to around 7 million units by the end of the decade.
E-Bikes in North America
On the other hand, North America is expanding rapidly, with the US experiencing a 19% increase in E-bike sales in 2020 compared to 2019. The US is currently leading in e-bike adoption, with more than 100 city and state-based incentives to boost e-bike adoption nationwide. Government incentives and growing environmental awareness are key drivers of this trend.
| Region/Country | E-Bike Sales (2022) | Projected Market Size (2030) |
| China | 35 million | £9.26 billion |
| North America | Doubled from 2019 | £61.9 billion |
| Europe | 7 million | £61.9 billion |
Factors Influencing E-Bike Popularity
- Environmental Benefits: E-bikes offer a zero-emission transport option, contributing to reduced air pollution and carbon footprint.
- Technological Advancements: Improvements in battery life, motor efficiency, and overall bike design enhance the appeal of e-bikes.
- Government Initiatives: Subsidies, investments in cycling infrastructure, and favourable regulations encourage e-bike adoption.
- Health and Fitness: E-bikes promote physical activity, appealing to health-conscious individuals.
FAQ - Electric Bikes
We strive to connect our customers with the right product and supplier. Would you like to be part of GreenMatch?
