- GreenMatch
- Blog
- UK Transport CO2
A Deep Dive Into UK Cities Transport CO2 Emission

Domestic transport in the UK emits 99 million tonnes of carbon dioxide equivalent (MtCO2e), with road travel accounting for 91% of these emissions, making it the largest emitting sector of greenhouse gas emissions. Transport carbon footprint was the largest emitter among UK local authorities, responsible for 28% of all UK emissions.
CO2 emissions from transport are unevenly distributed throughout the UK, with areas such as Bolsover and Wrexham, as well as rural areas like Cornwall, Midlands towns such as Buckinghamshire and North Northamptonshire, and towns around the Welsh border experiencing high levels of emissions. The average city resident in the UK emits around 1.4 tonnes of CO2 per year from transportation, compared to 2.5 tonnes for people outside cities.
Cities with the highest CO2 emissions
In 2022, UK transportation emissions increased by an estimated 3.8 per cent year-on-year to 112.5 million metric tons of carbon dioxide (MtCO₂). After examining the variation in transport emissions across different local authorities in the UK from various means of transport, such as trains, coaches, and private cars, here are the top cities with the highest CO2 per resident.
| Ranking | Local Authority | Transportation CO2 footprint |
| 2 | Wrexham | 683 |
| 3 | South Derbyshire | 661 |
| 4 | North Northamptonshire | 646 |
| 5 | Stoke-on-Trent | 638 |
| 7 | Stockton-on-Tees | 603 |
| 8 | Kingston upon Hull | 602 |
| 9 | Cornwall | 505 |
| 10 | Leeds | 474 |
| 11 | Birmingham | 451 |
Use the interactive map below to see how much CO2 emissions are in your city by transportation for approximately 15 kilometres commute.
CO2 Emissions from transport by local authority per 1000 residents for a journey estimated at per kilometre daily commute.
It is important to note that most cities in the London area may have low CO2 emissions. The low emissions in these areas can be attributed to various factors, including split into smaller cities, but when combined, it could be very high.
Transport CO2 major culprit
Cars stand out as the most significant contributor when evaluating the carbon footprint of different transport sectors. Cars are the primary source of transport CO2 emissions in the UK. Both petrol and diesel cars have a high carbon footprint, with diesel cars being the worst.
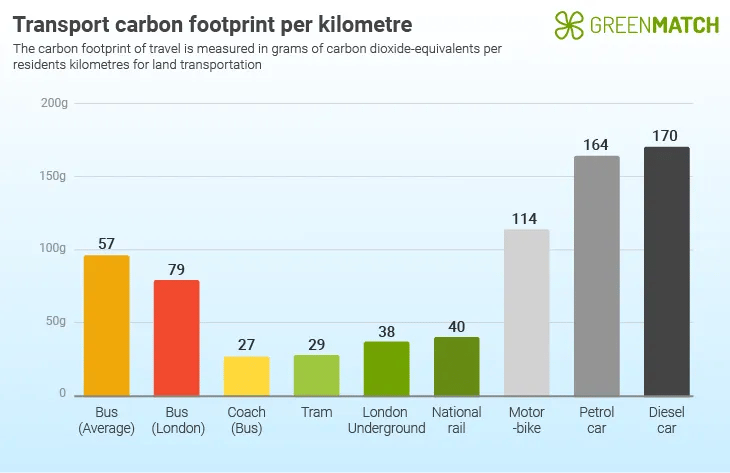
In 2023, cars accounted for 52% of all domestic vechicle emissions. The UK's average petrol car produces 164 grams of CO2 per kilometre, equivalent (g CO2e), while a diesel car produces 170 grams of CO2/km. The other means are heavy Goods Vehicles (HGVs) (19% of domestic transport emissions, 18.6 MtCO2e) and vans (16% of emissions, 16 MtCO2e).
This figure increases to 26% when considering the greenhouse gas emissions of transport on a residence basis among these cities, with their high number of cars per capita. Therefore, more vehicles per capita may lead to increased CO2 emissions.
| Highest emission cities | Lowest emission cities |
| Stockton-on-Tees | Bristol |
| Warrington | York |
| Halton | Cambridge |
| Redcar and Cleveland | Brentwood |
| Hartlepool | Exeter |
| Darlington | Brighton and Hove |
| Kingston upon Hull | Rother |
| Blackburn with Darwen | Isles of Scilly |
| Middlesbrough | Wokingham |
| North East Derbyshire | Reading |
Overall CO2 output emitted from an average car per 15 Kilometers interactive map
Carbon emission across the transport sector
In 2022, UK transportation emissions increased by an estimated 3.8 per cent year-on-year to 112.5 million metric tons of carbon dioxide (MtCO₂).
CO2 emissions from different modes of transport vary significantly across UK local authority cities, with major cities like London, Birmingham, and Leeds contributing the most to emissions. These emissions considerably impact air quality and public health, particularly for vulnerable populations.

Comparative analysis for CO2 emissions by transport
Climate change is a pressing issue, and understanding the carbon emissions by transport type is crucial in addressing this challenge. Walking, cycling, or running are the most environmentally friendly options for transportation, as they produce no CO2 emissions. We will explore the comparative analysis of CO2 emissions by all means of transport in the UK in 2023.
While the data on CO2 emissions from land transportation in England and Wales is concerning, there are many steps we can all take to help reduce these emissions. By choosing greener modes of transport, such as cycling to work or walking, and supporting policies that promote sustainability, we can all play a part in combating climate change.

Inemesit is a seasoned content writer with 9 years of experience in B2B and B2C. Her expertise in sustainability and green technologies guides readers towards eco-friendly choices, significantly contributing to the field of renewable energy and environmental sustainability.
We strive to connect our customers with the right product and supplier. Would you like to be part of GreenMatch?

