- GreenMatch
- Blog
- Greenest Countries
The World's Greenest Countries

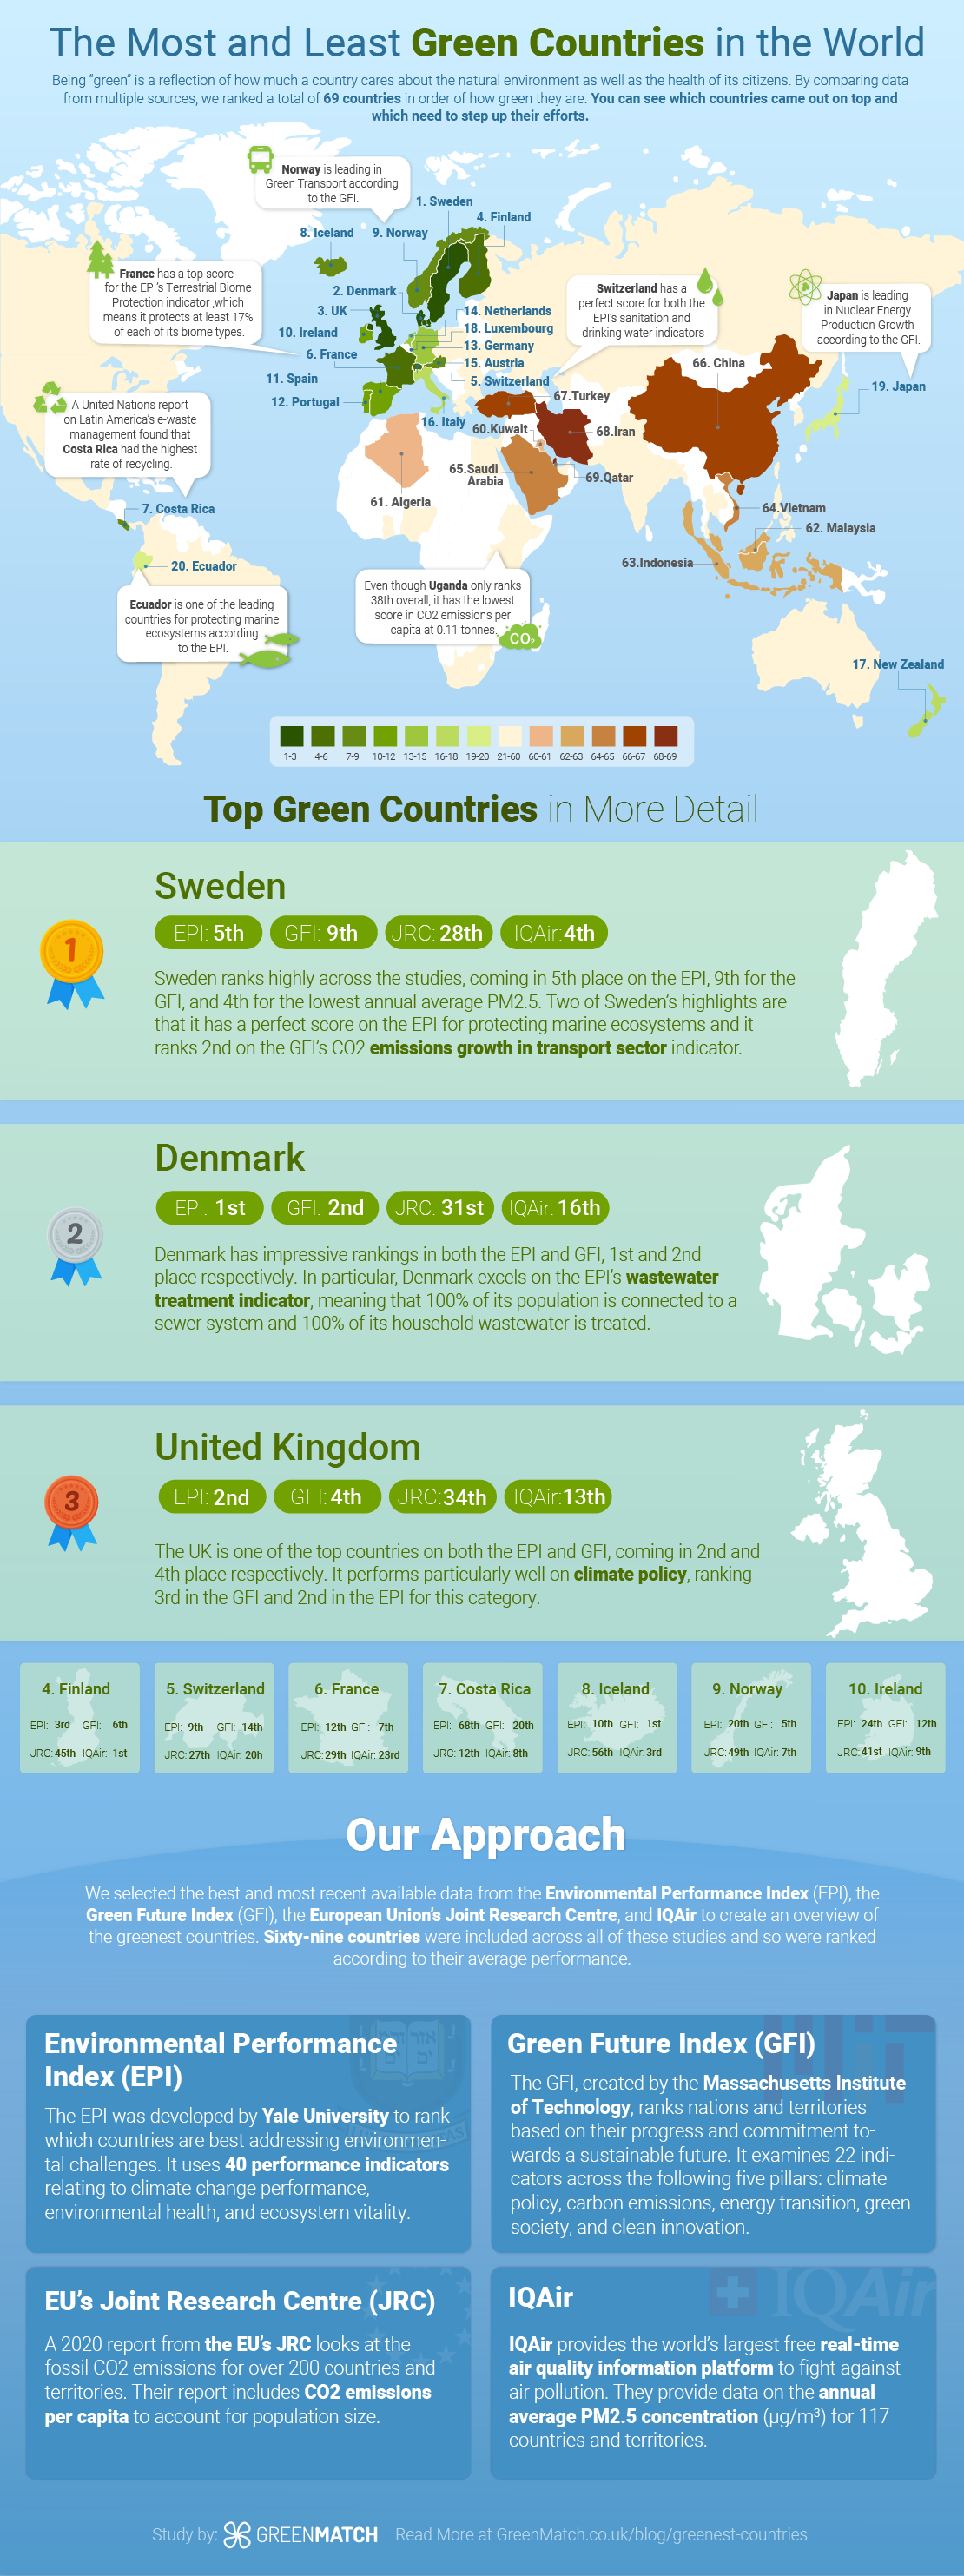
Being “green” reflects how much a country cares about preserving and restoring the natural environment and its resources, as well as the health of its citizens. This is shown through policymaking and the effectiveness of current measures.
However, as we’ll see, some countries prioritise the environment more than others.
We've conducted a comprehensive study analysing the most and least green countries globally. We combined and compared 4 different reports, namely the Environmental Performance Index (EPI) from Yale University, a report from the EU's Joint Research Centre (JRC), the Green Future Index (GFI) from Massachusetts Institute of Technology (MIT), and the IQ Air information platform.
European countries dominate the top 10 list.
Previously, one small nation in Central America was making its mark. Costa Rica was the 7th greenest country based on our analysis. However, it now ranks 15th under Latin America & Caribbean and 68th in global score based on EPI.
This updated analysis of the world's greenest countries incorporates the latest data.
We also compared these results with people's perceptions of the greenest countries. And the deviation in results is quite intriguing.
If you would like to use this infographic on your website, use the embed code below:
Top 10 Greenest Countries
According to the latest rankings, Denmark has emerged as the greenest country globally, thanks to its robust environmental policies and commitment to renewable energy. Following closely are the United Kingdom and Finland, both known for their sustainable practices and high environmental standards.
The top 10 greenest countries are as follows:
1) Sweden
Coming in at first place is Sweden. Sweden ranks highly across the studies, coming in 5th place on the EPI, 9th for the GFI, and 4th for the lowest annual average PM2.5 concentration at 6.6 μg/m³.
However, like most European countries Sweden’s main downfall is its CO2 emissions per capita, ranking only 28th place with 4.18 tonnes (4th in Europe). Known for its innovation in renewable energy, Sweden has an EPI score of 72.7, highlighting its effective environmental policies.
Some of Sweden’s highlights are that it has a perfect score in the EPI for protecting marine ecosystems and it ranks second in the GFI’s CO2 emissions growth in transport sector indicator.
2) Denmark
Denmark is considered to be a pioneer in promoting sustainability, so it is no surprise that it ranks so highly. It has an impressive ranking on both the EPI and the GFI, 1st and 2nd place respectively.
However, it does rank relatively lower in terms of its CO2 emissions per capita and annual average PM2.5 concentration. At 31st place with 4.43 tonnes for the former and at 16th place with 9.6 μg/m³ for the latter.
One of Denmark’s highlights is that it comes out on top for the EPI’s wastewater treatment indicator. Which means 100% of its population is connected to a sewer system and 100% of its household wastewater is treated.
3) United Kingdom
Despite its history the UK has been making headway in recent years as it aims to meet its net zero target by 2050. Ranking 2nd for the EPI and 4th for the GFI, it is clear that the UK is determined to make a greener future a reality.
Following closely with an EPI score of 77.7, the UK excels in ecosystem vitality and climate change mitigation despite its industrialized status. However, it still has some work to do in regards to its CO2 emissions and annual average PM2.5 concentration. It ranks in 34th place with 4.66 tonnes for the former and in 13th place with 8.8 μg/m³ for the latter.
The UK performs particularly well for climate policy, ranking 3rd in the GFI and 2nd in the EPI for this category.
4) Finland

Finland ranks 3rd on the EPI and 6th on the GFI. In particular, Finland excels in the GFI’s Clean Innovation pillar, ranking first. Furthermore, it achieves first place for the lowest annual average PM2.5 concentration with 5.5 μg/m³.
Out of the four studies, Finland mainly needs to focus on reducing its CO2 emissions, as it ranks 45th place with 7.29 tonnes per capita. The nation is already implementing change and plans to reduce its dependence on fossil fuels by 50% by 2030.
5) Switzerland

Switzerland placed 9th on the EPI and 14th on the GFI. It scores relatively lower for its CO2 emissions per capita and annual average PM2.5 concentration. Ranking 27th with 4.07 tonnes and 20th with 10.8 μg/m³, respectively.
Switzerland has a perfect score for both the EPI’s sanitation and drinking water indicators, meaning it has among the lowest DALY rates (age-standardised disability-adjusted life-years lost per 100,000 persons) in the world. The country's goal to achieve 100% renewable energy by 2050 is a testament to its forward-thinking approach.
6) France

Next on the list is France, which ranks 12th on the EPI and 7th on the GFI. This nation produces 4.26 tonnes of CO2 emissions per capita, meaning it comes in at 29th. Furthermore, France has an annual average PM2.5 concentration of 11.4 μg/m³, making it 23rd on the list.
In 2015, France became an early adopter of the United Nations' Sustainable Development Goals. Therefore, it’s understandable why it ranks 4th place for the GFI’s Climate Policy pillar.
7) Costa Rica
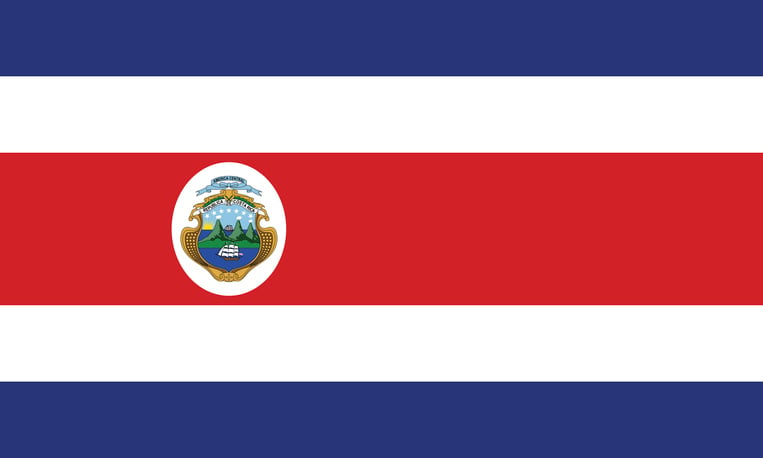
Costa Rica, the first non-European country on the list, is a true front-runner when it comes to creating a more sustainable future. It comes in 8th place for the lowest annual average PM2.5 concentrations with 7.8 μg/m³. Furthermore, it ranks 12th with 1.55 tonnes in regards to CO2 emissions per capita and 20th in the GFI.
However, out of the 180 nations assessed in the EPI, Costa Rica only places 68th. Despite this, the EPI still gave Costa Rica a perfect score for SO2 growth rate, meaning it’s cutting emissions by ≥3.94% per year.
8) Iceland
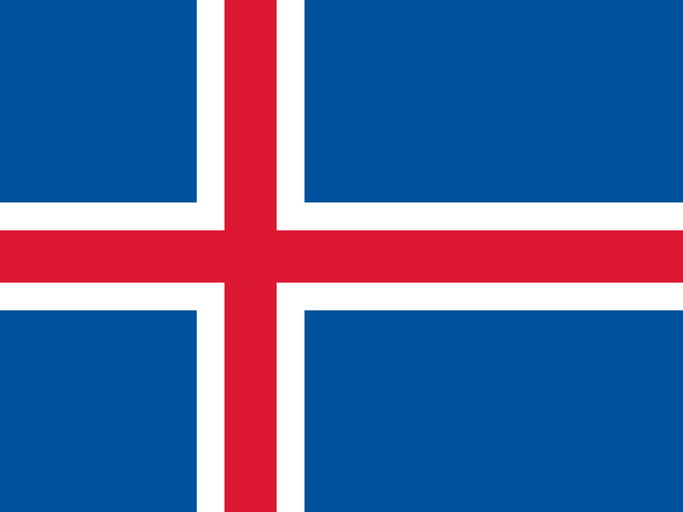
Iceland is considered to be the top nation by the GFI and ranks in 10th place in the EPI. It also has a low annual average PM2.5 concentration of 6.1 μg/m³, ranking 3rd place.
However, Iceland’s CO2 emissions per capita have room for improvement as it ranks 56th with 9.23 tonnes. The government plans to achieve carbon neutrality by 2040 and be fossil-fuel-free by 2050, so we should see Iceland moving up the rankings in the coming years.
9) Norway
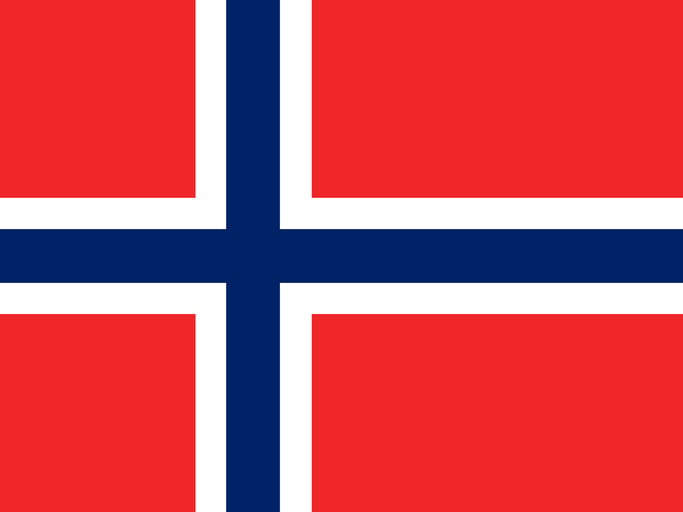
Norway ranks 20th on the EPI and 5th on the GFI. According to the GFI, it is leading in the area of Green Transport. Norway has an annual average PM2.5 concentration of 7.5 μg/m³ and 7.74 tonnes of CO2 emissions per capita, making it rank in 7th and 49th place respectively.
In order to become even greener, Norway plans to reduce 90-95% of its greenhouse gas emissions (excluding sinks) from 1990 levels by 2050.
10) Ireland
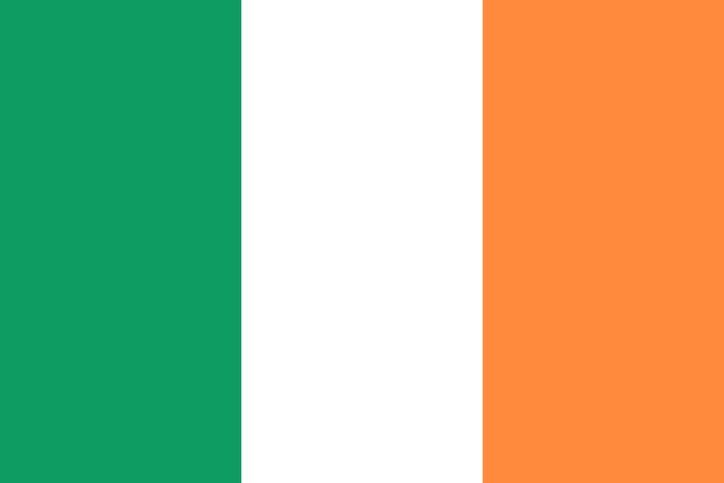
Ireland comes in 24th place on the EPI and 12th on the GFI. A highlight being that it ranks 3rd on the GFI’s Green Society pillar. Furthermore, Ireland ranks 9th for the lowest annual average PM2.5 concentrations with 8 μg/m³.
However, Ireland only ranks 41st in CO2 emissions per capita, with 6.68 tonnes. To address this, the government has created a Climate Action Plan which commits Ireland to reach net zero no later than 2050.
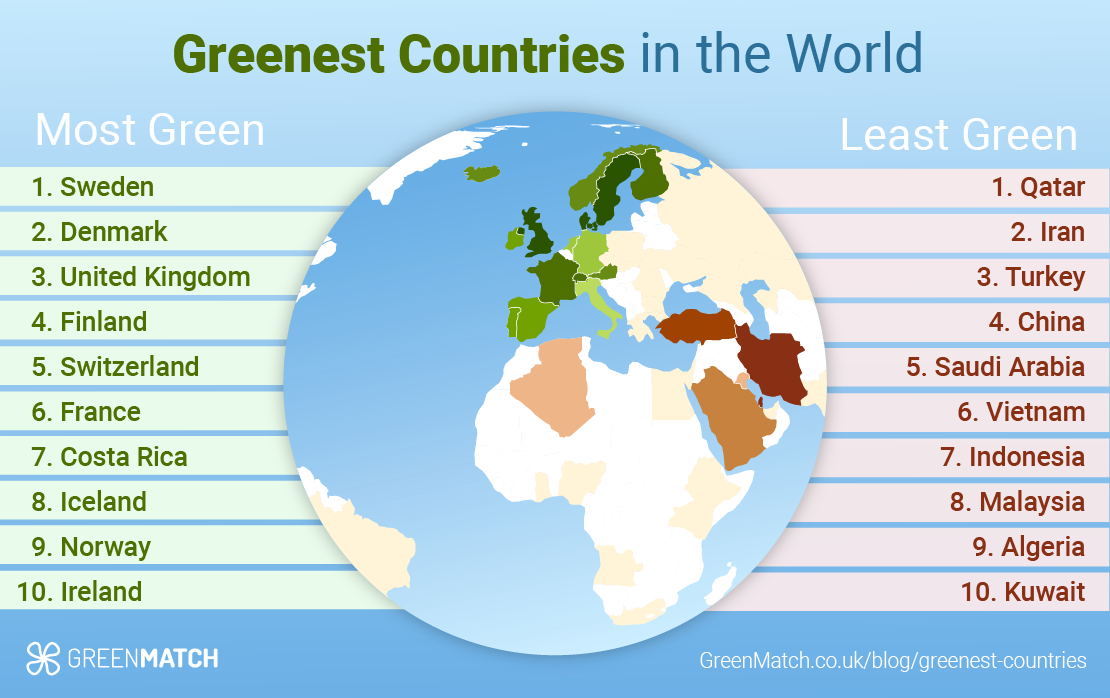
If you would like to use this infographic on your website, use the embed code below:
Bottom 10 Greenest Countries
The bottom 10 greenest countries are as follows:
1) Qatar

Unfortunately, Qatar places last on our list of greenest countries. It ranks 137th on the EPI and 73rd on the GFI. Its annual average PM2.5 concentration is a worrying 38.2 μg/m³, placing it 66th. Qatar also comes in last place for its CO2 emissions per capita with 35.64 tonnes.
This is backed up by the UN’s evaluation of Qatar’s progress towards achieving the Sustainable Development Goals. In regards to goal 7 (Affordable and Clean Energy) and goal 13 (Climate Action), major challenges remain, and for goal 11 (Sustainable Cities and Communities), significant challenges still remain.
2) Iran
Iran also needs to improve in regards to its sustainability efforts. It only ranks 133rd on the EPI and 76th on the GFI. In regards to CO2 emissions per capita it ranks 52nd with 8.26 tonnes, and for annual average PM2.5 concentrations it ranks 59th with 30.3 μg/m³.
The Sustainable Development Report also assesses that major challenges still remain for Iran in regards to affordable and clean energy. Furthermore, for goals 11 and 13, Iran is assessed to be stagnating with significant challenges remaining.
3) Turkey
Turkey does not fare well on either the EPI or GFI, ranking 172nd and 69th place respectively. It also ranks 48th place for the lowest annual average PM2.5 concentrations with 20 μg/m³ and 35th place for CO2 emissions per capita with 4.83 tonnes.
This is confirmed by the Sustainable Development Report, that states challenges remain for affordable and clean energy, significant challenges remain for sustainable cities and communities, and major challenges remain for climate action.
4) China

China has quite a striking difference in where it ranks on the EPI compared to the GFI, 160th for the former and 26th for the latter. For annual average PM2.5 concentrations, it ranks 61st with 32.6 μg/m³, and for CO2 emissions per capita it ranks 51st with 8.2 tonnes.
In regards to the Sustainable Development goals, (significant) challenges remain for China across goals 7, 11, and 13. However, it is moving in the right direction, as it is deemed to be “moderately increasing” across these goals.
5) Saudi Arabia
Saudi Arabia also has some way to go in regards to becoming more green. It ranks 109th on the EPI and 51st on the GFI. Its scores for annual average PM2.5 concentrations and CO2 emissions per capita are also not great. Ranking 62nd with 32.7 μg/m³ for the former and 66th with 16.96 tonnes for the latter.
Looking at the Sustainable Development Goals it is clear that both significant and major challenges remain for Saudi Arabia in regards to goals 7, 11, and 13. However, it has been assessed as “moderately increasing” across these goals, so hopefully there will be improvements in the near future.
6) Vietnam

Vietnam performs relatively well in regards to its CO2 emissions per capita, ranking 21st with 3.27 tonnes. However, its rankings across the other studies could do with a major boost. It ranks 178th on the EPI, 56th on the GFI, and 53rd for the lowest annual average PM2.5 concentrations with 24.7 μg/m³.
According to the Sustainable Development Report, (significant) challenges remain for Vietnam in the areas of affordable and clean energy, sustainable cities and communities, and climate action.
7) Indonesia
Indonesia’s total carbon emissions are relatively high at 568.27 Mt, however, due to its large population size it only produces 2.09 tonnes per capita, leaving it in 17th place. Otherwise, Indonesia ranks quite poorly. It is 164th on the EPI and 70th on the GFI. In regards to the lowest annual average PM2.5 concentrations, it ranks 64th with 34.3 μg/m³.
This is confirmed by the Sustainable Development Report, which states challenges still remain across goals 7, 11, and 13 for Indonesia. In particular for goal 11 (Sustainable Cities and Communities).
8) Malaysia
Malaysia also ranks in the bottom ten for the greenest countries in the world. It comes in 130th place on the EPI and 65th on the GFI. It ranks 50th for CO2 emissions per capita with 7.98 tonnes, and 45th place for annual average PM2.5 concentrations with 19.4 μg/m³.
This is backed up by the Sustainable Development Report, which states that challenges (of varying magnitudes) remain for Malaysia in regards to goals 7, 11, and 13.
9) Algeria
Algeria is another country in the bottom ten that ranks relatively well in terms of its CO2 emissions per capita, in 23rd place with 3.77 tonnes. However, it still has work to do in regards to the other metrics. It ranks 155th on the EPI, 75th on the GFI, and 47th on the lowest annual average PM2.5 concentrations with 20 μg/m³.
In regards to the Sustainable Development goals, significant and major challenges remain for Algeria across goals 7, 11, and 13. In addition to this, for goal 11 (Sustainable Cities and Communities) it has even been deemed to be regressing.
10) Kuwait
Finally, we have Kuwait which ranks 61st out of the 69 countries on this list. It comes in 87th position for the EPI and 58th for the GFI. It has a rank of 68th for CO2 emissions per capita with 20.91 tonnes and ranks 58th for the lowest annual average PM2.5 concentrations with 29.7 μg/m³.
Again, this is confirmed by the Sustainable Development Report, which assesses Kuwait to have significant and major challenges remaining across goals 7, 11, and 13.
Do people’s perceptions match the results?
Interestingly enough, people’s perceptions of how environmentally friendly and sustainable various countries are is generally in agreement with our final ranking.
A survey conducted by InterNations in 2020 found similar results. They surveyed 15,000 expats who represented 173 nationalities and lived in 181 countries or territories.
In the survey they rated their personal satisfaction on the following topics: air quality, the natural environment, water and sanitation, the availability of green goods and services, energy supply, and the local waste management and recycling infrastructure.
They also rated how strongly they thought the governments support policies to protect the environment and how interested they perceived the local population to be concerning environmental issues.
InterNations included 60 countries in their final ranking. Fifty-one of these countries were included in both our final ranking as well as InterNations’. Therefore, InterNations’ top 10 is as follows:
As you can see, Finland, Sweden, Norway, Austria, Switzerland, and Denmark are also included in our final top 10 greenest countries. Germany, New Zealand, and Luxembourg place in our top 20, and Canada places above the 50th percentile. It should also be noted that Iceland was not included in InterNations’ survey.
Looking at InterNations’ bottom 10 based on these 51 countries, you can see it is a similar story:
China, Saudi Arabia, Vietnam, Indonesia, and Kuwait also place in our bottom 10 greenest countries. Egypt, India, Thailand, and the Philippines, although not in our bottom 10, still rank below the 50th percentile. Kenya is the only anomaly which ranks around the midway point at 33rd in our final ranking.
When looking at our bottom 10, you’ll see that Qatar, Turkey, and Malaysia also rank below the 50th percentile in InterNations' study. Algeria and Iran were not included in InterNations’ final ranking and so cannot be compared.
Methodology
There are many metrics and indices out there that measure different aspects of what makes a country green. For example, the Environmental Performance Index (EPI) by Yale University and the Green Future Index (GFI) by Massachusetts Institute of Technology (MIT) are two of the most renowned indices available.
Both of these indices are comprehensive and rank countries based on environmental indicators, however, there are differences in their methodology including which metrics they choose to assess.
Therefore, we wanted to create an overview of the best and most recent data available to obtain a complete as possible picture of the world’s greenest countries. In combination with the two aforementioned indices, we wanted to look at countries’ CO2 emissions per capita and their annual average PM2.5 (Particulate Matter) concentrations.
We wanted to combine these four studies to gain a better understanding of which countries are taking sustainability seriously, both now and in the future. With for instance the use of solar panels and air source heat pumps.
Some of the studies listed below included territories in their data. We removed these from our analysis as we specifically wanted to compare countries. We then ranked the available countries separately on both their CO2 emissions and PM2.5 concentrations (with the lowest amounts ranking the highest).
We then removed any of the countries that were not included in all four studies, so that none of the final countries were missing data points. Thus, sixty-nine countries were included in the final assessment.
We then took the average ranking across all four studies for each country, so we could see which countries consistently came out on top and ranked them from position 1 to 69.
Each study will be explained in more detail below:
Environmental Performance Index (2022)
The Environmental Performance Index (EPI) was developed by Yale University to rank which countries are best addressing environmental challenges. It uses 40 performance indicators relating to climate change performance, environmental health, and ecosystem vitality.
Alongside the fact it covers 40 indicators, it is considered to have some of the most extensive research on this topic due to the fact that it covers 180 countries. Even though EPI is deemed reliable, it is important to keep in mind that some countries are missing data on specific metrics, and also that not all of the data is taken from the last couple of years.
Green Future Index (2022)
The Green Future Index (GFI) by Massachusetts Institute of Technology (MIT) ranks 76 nations and territories based on their progress and commitment towards a sustainable future. It examines 22 indicators across the following five pillars: climate policy, carbon emissions, energy transition, green society, and clean innovation.
The GFI is a great starting point when it comes to comparing the greenest countries. However, one important thing to keep in mind is that a significant part of the GFI focuses on what countries plan to do going forward. While policy changes are important they are not guaranteed. This point also applies to the EPI.
European Union's Joint Research Centre (2020)
A 2020 report from the European Union’s Joint Research Centre looks at the fossil CO2 emissions of more than 200 countries and territories. It includes CO2 emissions per capita to account for population size.
We believe the inclusion of this metric is important as carbon dioxide is the main and most harmful pollutant in regards to global warming. Furthermore, it shows how countries’ carbon footprints currently stand, as opposed to a hypothetical future.
IQAir (2021)
IQAir provides the world’s largest free real-time air quality information platform to fight against air pollution. They provide data on the annual average PM2.5 concentration (μg/m³) for 117 countries and territories.
PM2.5 refers to fine particles with a diameter of less than 2.5 micrometres. They remain suspended in the air for longer durations and can travel deep into the respiratory tract and even enter the bloodstream.
It is associated with increased rates of lung cancer and heart disease. The World Health Organisation's air quality guideline values are 5 μg/m3 for an annual mean and 15 μg/m3 for a 24-hour mean.
This metric was chosen as the pollutant PM2.5 poses a major health risk to the world’s population. Moreover, similar to the CO2 emissions per capita, this data point shows how countries are currently performing and consequently affecting people’s health.
As we move towards 2025, the focus on sustainable development only intensifies. Countries at the top of our list are expected to continue their leadership in green technologies and sustainable practices. However, dynamic changes in policies and global environmental conditions could influence future rankings.
Continuous monitoring and adaptation of policies are essential for maintaining and improving environmental performance.

Brontë is an experienced writer and editor for GreenMatch. Her passion for sustainability and renewable energy drives her to stay at the forefront of green-energy trends.
We strive to connect our customers with the right product and supplier. Would you like to be part of GreenMatch?

