Average Fossil Fuel Consumption in UK Cities


Fossil fuels have long been the backbone of the UK's energy infrastructure, powering homes, businesses, and transportation. Although the country is moving towards decarbonisation goals, day-to-day, we’re still consuming fossil fuels at a fast pace. Understanding the average fossil fuel consumption across UK cities can help us assess progress and identify areas for further action.
The UK still has almost 80% energy dependency on fossil fuels, so knowing how we use energy and which areas of the country most rely on fossil fuels is important. Growing concerns over climate change and the need for sustainable energy sources have prompted a shift towards cleaner alternatives, but are we doing enough?
This article will look closely at the patterns of fossil fuel consumption in UK cities, examining key statistics, underlying factors, and the ongoing efforts to reduce reliance on these finite resources. By providing insights into urban energy usage, our analysis aims to inform and highlight the challenges and opportunities associated with transitioning to a low-carbon future.
Key statistics and trends
- Birmingham ranks highly as one of the largest fossil fuel-consuming cities in the UK.
- London, Manchester and Birmingham have the highest electricity consumption in the UK.
- Gas consumption is highest in Birmingham, London and Sheffield.
- The lowest-consuming cities are Glasgow, Edinburgh, and Liverpool.
- Factors influencing consumption include population, infrastructure, economic activity, and government policies.
Methodology
It was important to gather data from the most reliable sources to gain a comprehensive understanding of fossil fuel consumption patterns in UK cities. For this analysis, we used data from the Department for Business, Energy & Industrial Strategy (BEIS) and reports from local councils and authorities.
Our study only included the top 10 major UK cities: London, Glasgow, Sheffield, Bristol, Edinburgh, Birmingham, Manchester, Leeds, Liverpool, and Cardiff. This gives us more detailed information to compare and provides a wider snapshot of the UK as a whole.
It is important to note that the latest available city-specific data is from 2021 / 2022, when fossil fuels accounted for a slightly higher percentage of the overall energy mix - as much as 40%. However, as of 2023, fossil fuels accounted for approximately 36.7% of the United Kingdom's electricity generation. This decrease is significant to keep in mind, as it’s a promising indication that more renewable energy systems are being implemented year on year.
We have chosen to analyse these datasets as we not only aim to compare the use of fossil fuels per city but also to build a picture of how energy demands differ across the country. Understanding how and where energy is used can give us insight into where change is needed.
Following our analysis, we will focus on the years ahead, looking at national and local government plans to understand what these major regions and their local communities can do to tackle fossil fuel consumption.
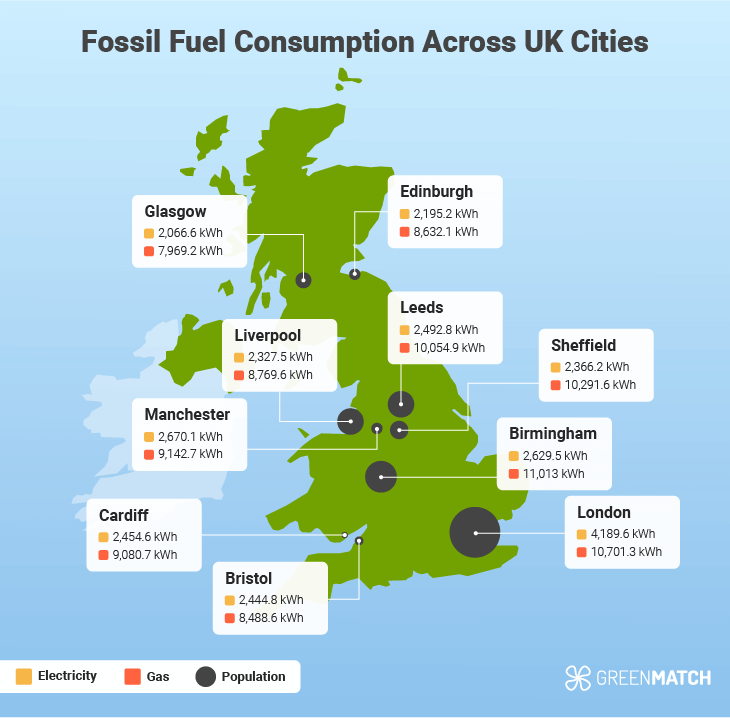
Average fossil fuel consumption data per major UK city
| UK City | Electricity (in kWh) | Gas (in kWh) | Other fuels inc. coal, oil, petrol (in ktoe*) |
|---|---|---|---|
| London | 4,189.6 | 10,701.3 | 4.8 |
| Glasgow | 2,066.6 | 7,969.2 | 36.8 |
| Sheffield | 2,366.2 | 10,291.6 | 58.3 |
| Bristol | 2,444.8 | 8,488.6 | 30.0 |
| Edinburgh | 2,195.2 | 8,632.1 | 32.9 |
| Birmingham | 2,629.5 | 11,013.0 | 77.4 |
| Manchester | 2,670.1 | 9,142.7 | 29.0 |
| Leeds | 2,492.8 | 10,054.9 | 77.2 |
| Liverpool | 2,327.5 | 8,769.6 | 22.6 |
| Cardiff | 2,454.6 | 9,080.7 | 50.8 |
All figures are combined totals across all sectors. These include domestic, transport, industrial, commercial, rail, public sector, and agriculture settings.
Analysis of UK city’s fossil fuel consumption
Looking at the data we have collected, we can see which areas of the country consume the most fossil fuels. Firstly, it’s quite clear that our top-most consuming cities are London, Manchester, Birmingham, Sheffield, and Leeds. Conversely, Liverpool, Edinburgh, and Glasgow are amongst the lowest consumers.
To better understand why this might be the case, we have looked at each city in more depth in our analysis below. Firstly, it’s good to get an understanding of the population density in each area.
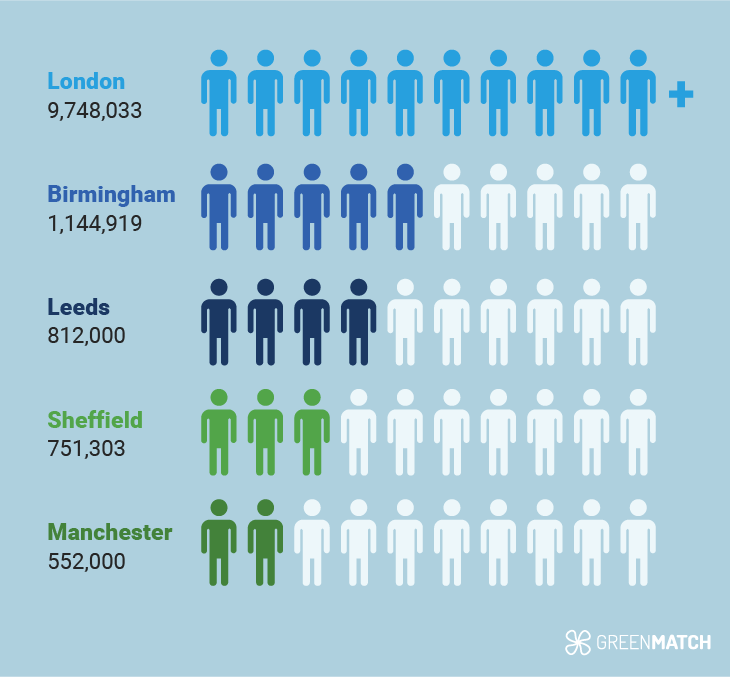
As we can see in the above visual, London and Birmingham have by far the largest populations, so it’s fair to assume this could be a main driver of their high fuel consumption.
What is surprising in this data, however, is that Manchester, despite having a far smaller population size, consumes more electricity than Birmingham. With nearly 600,000 fewer residents, this is an interesting point for us to consider.
In terms of gas use, Birmingham also far surpasses London, despite London's population being over 8 million more than Birmingham's.
To find out what drives these drastic differences, we’ll look more closely and compare these cities to find out how they consume fuel and what could influence consumption patterns. We will also explore the areas with the lowest consumption to discover what makes those cities unique.
| Highest fossil fuel-consuming cities | ||
|---|---|---|
| Electricity | (in kWh) | Population |
| London | 4,189.60 | 9,748,033 |
| Manchester | 2,670.10 | 552,000 |
| Birmingham | 2,629.50 | 1,144,919 |
| Gas | (in kWh) | Population |
| Birmingham | 11,013.00 | 1,144,919 |
| London | 10,701.30 | 9,748,033 |
| Sheffield | 10,291.60 | 751,303 |
| Other fuels | (in ktoe) | Population |
| Birmingham | 77.4 | 1,144,919 |
| Leeds | 77.2 | 812,000 |
| Sheffield | 58.3 | 751,303 |
| Lowest fossil fuel-consuming cities | ||
|---|---|---|
| Electricity | (in kWh) | Population |
| Glasgow | 2,066.60 | 626,410 |
| Edinburgh | 2,195.20 | 506,520 |
| Liverpool | 2,327.50 | 864,122 |
| Gas | (in kWh) | Population |
| Glasgow | 7,969.20 | 626,410 |
| Bristol | 8,488.60 | 465,866 |
| Edinburgh | 8,632.10 | 506,520 |
| Other fuels | (in kWh) | Population |
| London | 4.8 | 9,748,033 |
| Liverpool | 22.6 | 864,122 |
| Manchester | 29 | 552,000 |
Comparing fossil fuel consumption in UK cities
London vs. Manchester - Electricity consumption
Population: 9,748,033 vs. 552,000

These two cities are top of the list when it comes to electricity consumption. Recent data shows, on average, London consumes approximately 4,189 kWh and Manchester 2,670 kWh. Despite their large population differences, both cities consume very high amounts of electricity per year, so why might this be?
There are several factors that can be attributed to these figures:
Urban density and infrastructure
Both cities are densely populated, with a high concentration of residential, commercial, and industrial buildings. This concentration often leads to a higher demand for electricity to power various amenities and services.
London and Manchester also have extensive transportation networks, including underground systems and tramways, which require significant amounts of electricity. Additionally, their large commercial districts often house numerous office buildings, retail spaces, and entertainment venues, all of which consume electricity for operations.
Economic activity
London, in particular, is a global financial centre, attracting numerous businesses and multinational corporations. These entities often have high energy demands, especially for office spaces, data centres, and other infrastructure.
Meanwhile, Manchester has historically had a thriving manufacturing industry. Although it has seen a decline in recent years, there is still a significant industrial presence in the city. Manufacturing processes often require substantial amounts of electricity for machinery, lighting, and heating.
Lifestyle factors
London and Manchester are both known for their high quality of life, which often translates to higher energy consumption. For example, residents may have more appliances, gadgets, and electronic devices, as well as larger homes with greater heating and cooling needs.
In addition, both cities are major cultural hubs, hosting numerous events, concerts, and festivals. These activities often require significant energy consumption for lighting, sound systems, and other infrastructure. They also encourage more tourism and the need for increased transport and leisure sector operations, such as hotels and restaurants.
Birmingham vs. London - Gas consumption
Population: 1,144,919 vs. 9,748,033

The use of natural gas is one of the largest contributors of carbon emissions, so it’s a key area of focus when looking at reducing a city’s reliance on fossil fuels. For gas consumption, Birmingham comes top of the list, with an average of 11,013 kWh in one year. London sits second to this at 10,701 kWh. With a population difference of almost 8 million, an important question has been raised by this data: Why is Birmingham consuming so much gas?
Here are some key considerations as to why this might be the case:
Housing stock and efficiency
Birmingham's housing stock is generally older than London's, with many homes dating back several decades. Older homes often have lower energy efficiency ratings and outdated heating systems, leading to higher gas consumption for heating and hot water.
Birmingham may also have a higher proportion of detached and semi-detached houses compared to London, which tend to have larger heating requirements than flats or apartments.
Industrial activities
Birmingham has a rich industrial history dating back centuries, and while its manufacturing sector has evolved over time, it still relies significantly on fossil fuels. Many industrial processes require gas for heating, power generation, or as a raw material.
The city is a major centre for automotive and aerospace industries, as well as advanced engineering. These industries often require gas for heating, drying, and other industrial processes. Currently, Birmingham produces over £2 billion worth of manufactured goods annually.
Although London also has a history of manufacturing, this changed rapidly in the 1990s, when more knowledge sectors and professional services took over in the city. Manufacturing now plays a much smaller role in London, which is now largely a global financial and service centre.
The differences between these cities' economic drivers are showing a marked difference in the way they both consume energy.
By understanding these factors, it becomes clearer why Birmingham's gas consumption is higher than London's, despite the significant population difference. Addressing these issues through energy efficiency measures, renewable energy adoption, and targeted policies can help reduce Birmingham's reliance on fossil fuels and transition towards a more sustainable energy future.
Glasgow vs London
Highest vs lowest consumption

Looking at the data we’ve gathered, Glasgow is at the bottom of our list regarding gas and electricity consumption. This would indicate that Glasgow is less reliant on fossil fuels for energy than our highest-consuming area, London.
Considering that both are major cities in the UK (despite their population differences), it’s crucial to understand the key differences that can lead to such dramatic variation in consumption rates.
Here are some key areas we have analysed that might shed light on this data:
Electricity generation
Despite being part of the same overall energy mix for the UK, England and Scotland have some differences. For example, Glasgow, like the rest of Scotland, has dramatically transformed its electricity generation mix.
In 2022, 87.9% of electricity generated in Scotland was from low-carbon sources, including nuclear, pumped hydro, and renewables. In contrast, for London (and the rest of England), the electricity mix is estimated to be closer to 50% from zero-carbon sources.
This gives us some insight into how fossil fuel consumption differs across these two cities. In addition, Scotland's last coal-fired power station closed in 2016, and oil and gas now provide just 11.4% of Scotland's electricity generation.
Government policies and incentives
When comparing any area of England with Scotland, it’s crucial to understand how differing Government policies can impact energy use. While energy policy is determined mainly at the UK government level, Scotland has some devolved powers and has set its own more ambitious targets for renewable energy.
Some key aims/targets for each city include:
Glasgow
- Committed to becoming carbon neutral by 2030 and achieving net-zero emissions by 2045.
- Reduced overall energy consumption by 24% between 2005 and 2020, with the largest reductions in domestic (22%) and industrial/commercial (28%) sectors.
- Focusing on decarbonising transport by increasing active travel and public transport use to reduce private vehicle emissions.
- Piloting district heating schemes to address the decarbonisation of heat in homes and businesses.
- Developing strategies for using vacant or derelict land for renewable energy generation or local food growing.
- Established the Sustainable Glasgow partnership to bring stakeholders from various sectors together to support the transition towards a low-carbon future.
London
- Introduced the Ultra Low Emission Zone to reduce vehicle emissions.
- Set a target for London to be net zero carbon by 2030.
- Working to transition from gas boilers to ultra-low NOx gas boilers and low-carbon heating alternatives like heat pumps.
- Implementing commercial boiler scrappage initiatives to incentivise more efficient heating systems.
- Endorsed the Fossil Fuel Non-Proliferation Treaty, calling for an end to fossil fuel dependence.
Both cities have implemented ambitious targets and policies to reduce fossil fuel consumption and transition to cleaner alternatives.
Transportation
London and Glasgow have both changed their transport sectors. Glasgow focuses on decarbonising and increasing the number of people travelling actively or using public transport instead of private vehicles. As of 2021, they have also installed 300 EV charging stations.
In London, Transport for London (TfL) is implementing several measures, including installing solar panels, LED lighting, and heat pumps in offices and depots. Upgrading heating systems with efficient heat pumps and infrared panel heaters to replace fossil fuel gas boilers
London is still planning and implementing its other goals, such as aiming to use 100% renewable electricity across TfL operations by 2030 and increasing the number of greener buses and zero-emission capable taxis.
Building regulations and energy systems
Across London and Glasgow, several changes have been made or are planned to reduce the energy drain that older buildings and heating systems are having on fuel resources. This includes the London Mayor backing incentives to transition from old, inefficient gas to renewable boilers that are low-carbon heating alternatives like heat pumps.
Glasgow is exploring other solutions and has piloted several district heating schemes to understand their role in reaching carbon neutrality. Projects like the Clyde Heat initiative are installing water source heat pumps to supply low-carbon heat via a heat network.
Where Glasgow has already been able to implement heating networks and utilise renewable energy sources, London faces more challenges due to its vast and complex infrastructure. This can make integrating new measures and renewable technologies much more difficult.
Taking a wider view of all of the differences between these cities, we can conclude that, whilst both cities have high ambitions to reduce fossil fuel consumption, Glasgow has been able to adopt changes more quickly due to devolved government powers, less complex infrastructure and greater direct access to renewable energy sources. There is also a point to consider here: Glasgow is a far less populated city, enhancing its ability to use less energy.
Creating a low-carbon future: Overcoming challenges and seizing opportunities
Our analysis of fossil fuel consumption in major UK cities reveals a diverse landscape of energy usage and decarbonisation efforts. While some cities, such as Glasgow, have significantly reduced their reliance on fossil fuels, others, like London and Birmingham, face unique challenges and opportunities.
To achieve a low-carbon future, a multifaceted approach is essential. Government policies, infrastructure investments, technological advancements, and individual actions are crucial in driving change. To reduce their carbon footprint, cities must prioritise renewable energy, energy efficiency, and sustainable transportation.
By understanding the factors influencing fossil fuel consumption and implementing targeted strategies, UK cities can transition towards a more sustainable and resilient energy future. Decarbonisation will require ongoing collaboration, innovation, and a commitment to a cleaner and healthier planet.


We strive to connect our customers with the right product and supplier. Would you like to be part of GreenMatch?
